Comment
Calculating housing need: a mischievous method managed?
As widely reported, the newly-launched consultation on proposed reforms to the National Planning Policy Framework includes a new standard method for assessing housing needs, taking an ambitious stock-based approach that we have long advocated with the support of the Home Builders Federation and the Land, Planning and Development Federation.
A new standard method is long overdue, with the current approach widely criticised and seen to be ineffective – not least by the Competition and Markets Authority (CMA) as we wrote earlier this year.
The Government, at that time, had no intention of reviewing its approach until new household projections became available in 2025. We argued that it did not need to wait and could pivot sooner towards a stock-based approach, which would overcome many of the issues related to trend-based demographic projections while delivering against the principles set out by the CMA by being:
- Easy to understand;
- Based on reliable evidence;
- Regularly applied but stable;
- Largely independent of adjustments linked to broader policy aims; and
- Aligned with a national target.
Having long advocated this approach, with the support of the Home Builders Federation and the Land, Planning and Development Federation, we are heartened to see the new Government now taking a similar view. Its proposals are bold and ambitious, as is necessary to tackle the housing crisis and realise its housebuilding goals.
What are the proposals?
The Government is proposing to remove household projections entirely, using 0.8% of the current stock as a baseline that is uplifted – more steeply than before[1] – to reflect the recent balance between house prices and earnings. The scale of this adjustment is no longer capped and the controversial urban uplift – applied to the twenty largest cities and urban areas – has also been dropped, with the Government instead aiming to raise ambition across a broader range of urban authorities.
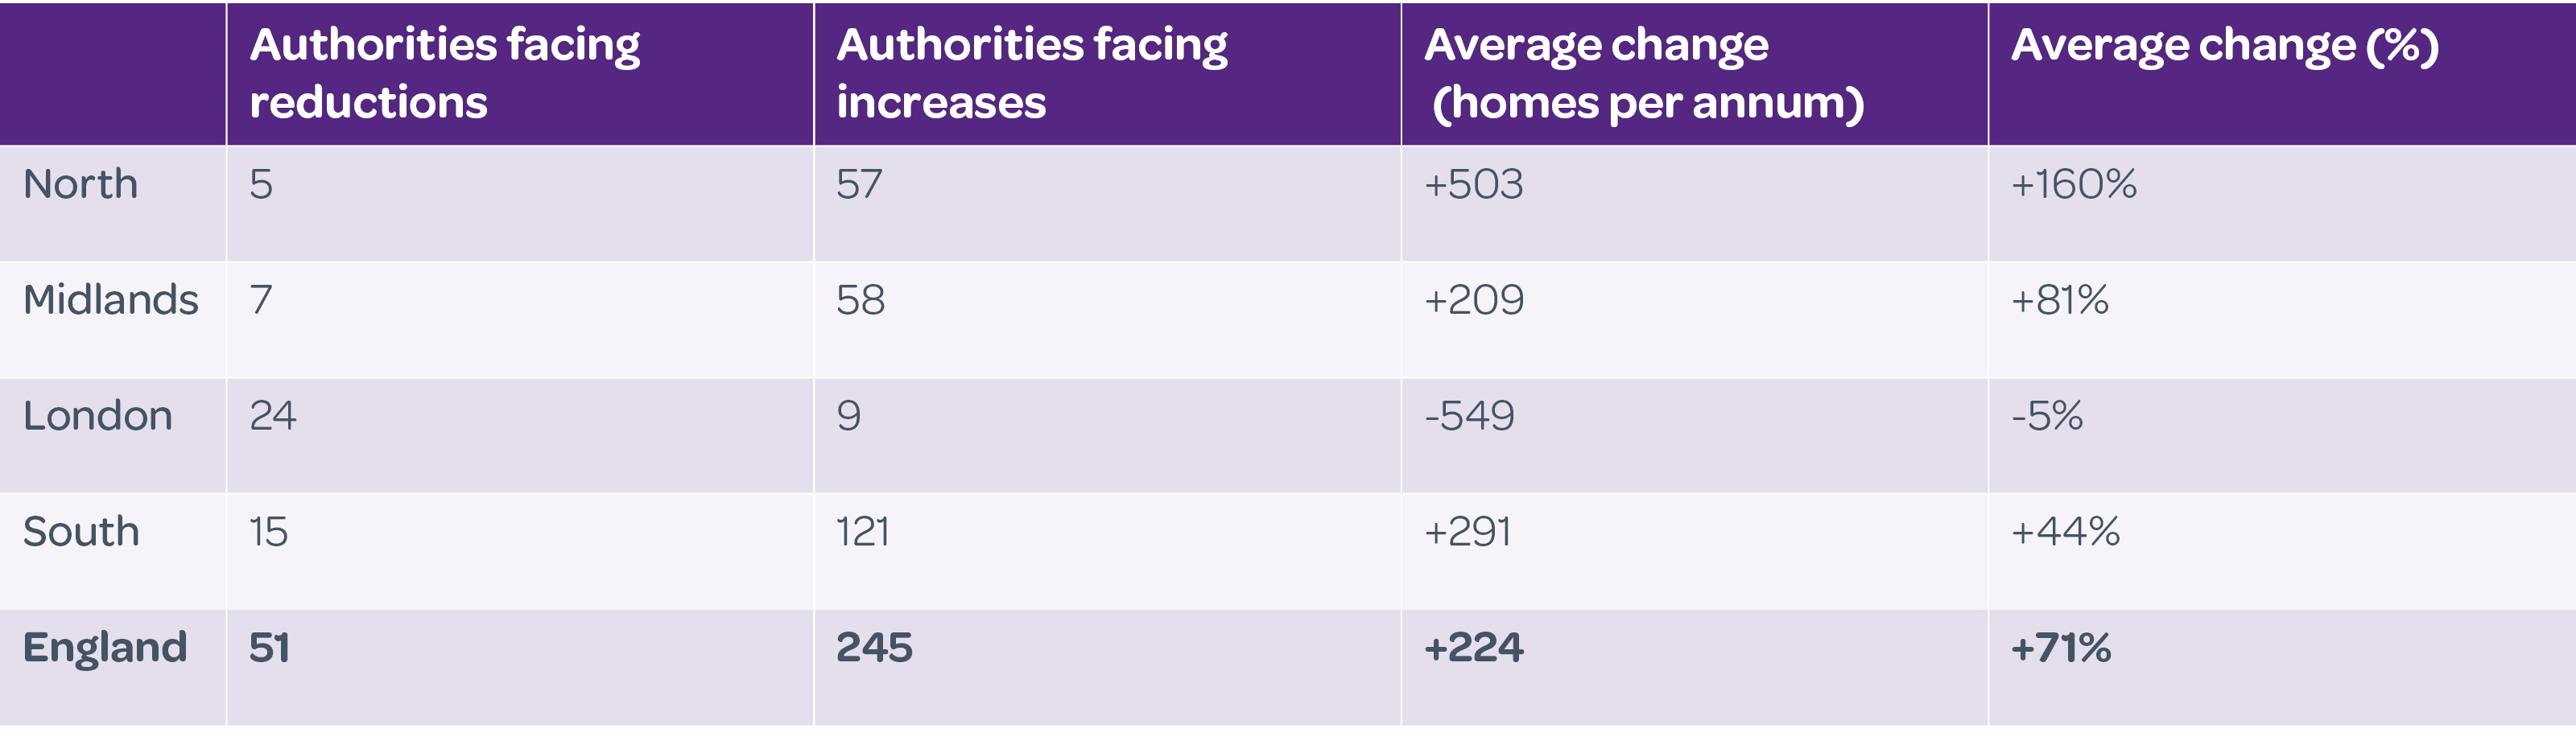
The summary conveniently published by Government shows that this new approach would markedly increase the overall national need produced by the standard method, from circa 305,200 to 371,500 homes per annum. The average local authority faces an increase of around 71% or 224 homes per annum, with all but a sixth seeing their numbers rise.
Aside from London (further detailed commentary on the capital to follow) Table 1 shows that authorities in the North[2] will experience the greatest change, as the new method adds an average of 503 dwellings per annum to their previous figures and typically increases them by 160%. Put another way, this would mean planning for around five homes for every two previously thought to be needed each year.
Putting the new figures in context
Such pronounced changes will inevitably bring concern around the realism of the new figures, but further interrogation shows that it is generally the old numbers that were the problem. Over half of local authorities across the North previously received figures equivalent to less than 0.5% of their existing housing stock, but each one had historically proven their ability to meet demand that is well in excess of the suggested need - around three times more, on average.
The new approach – in which every local authority in the country grows its stock by at least 0.8% each year – asks more of these areas, not unreasonably it could be argued given the demonstrated demand for significantly more homes than envisaged under the previous approach.
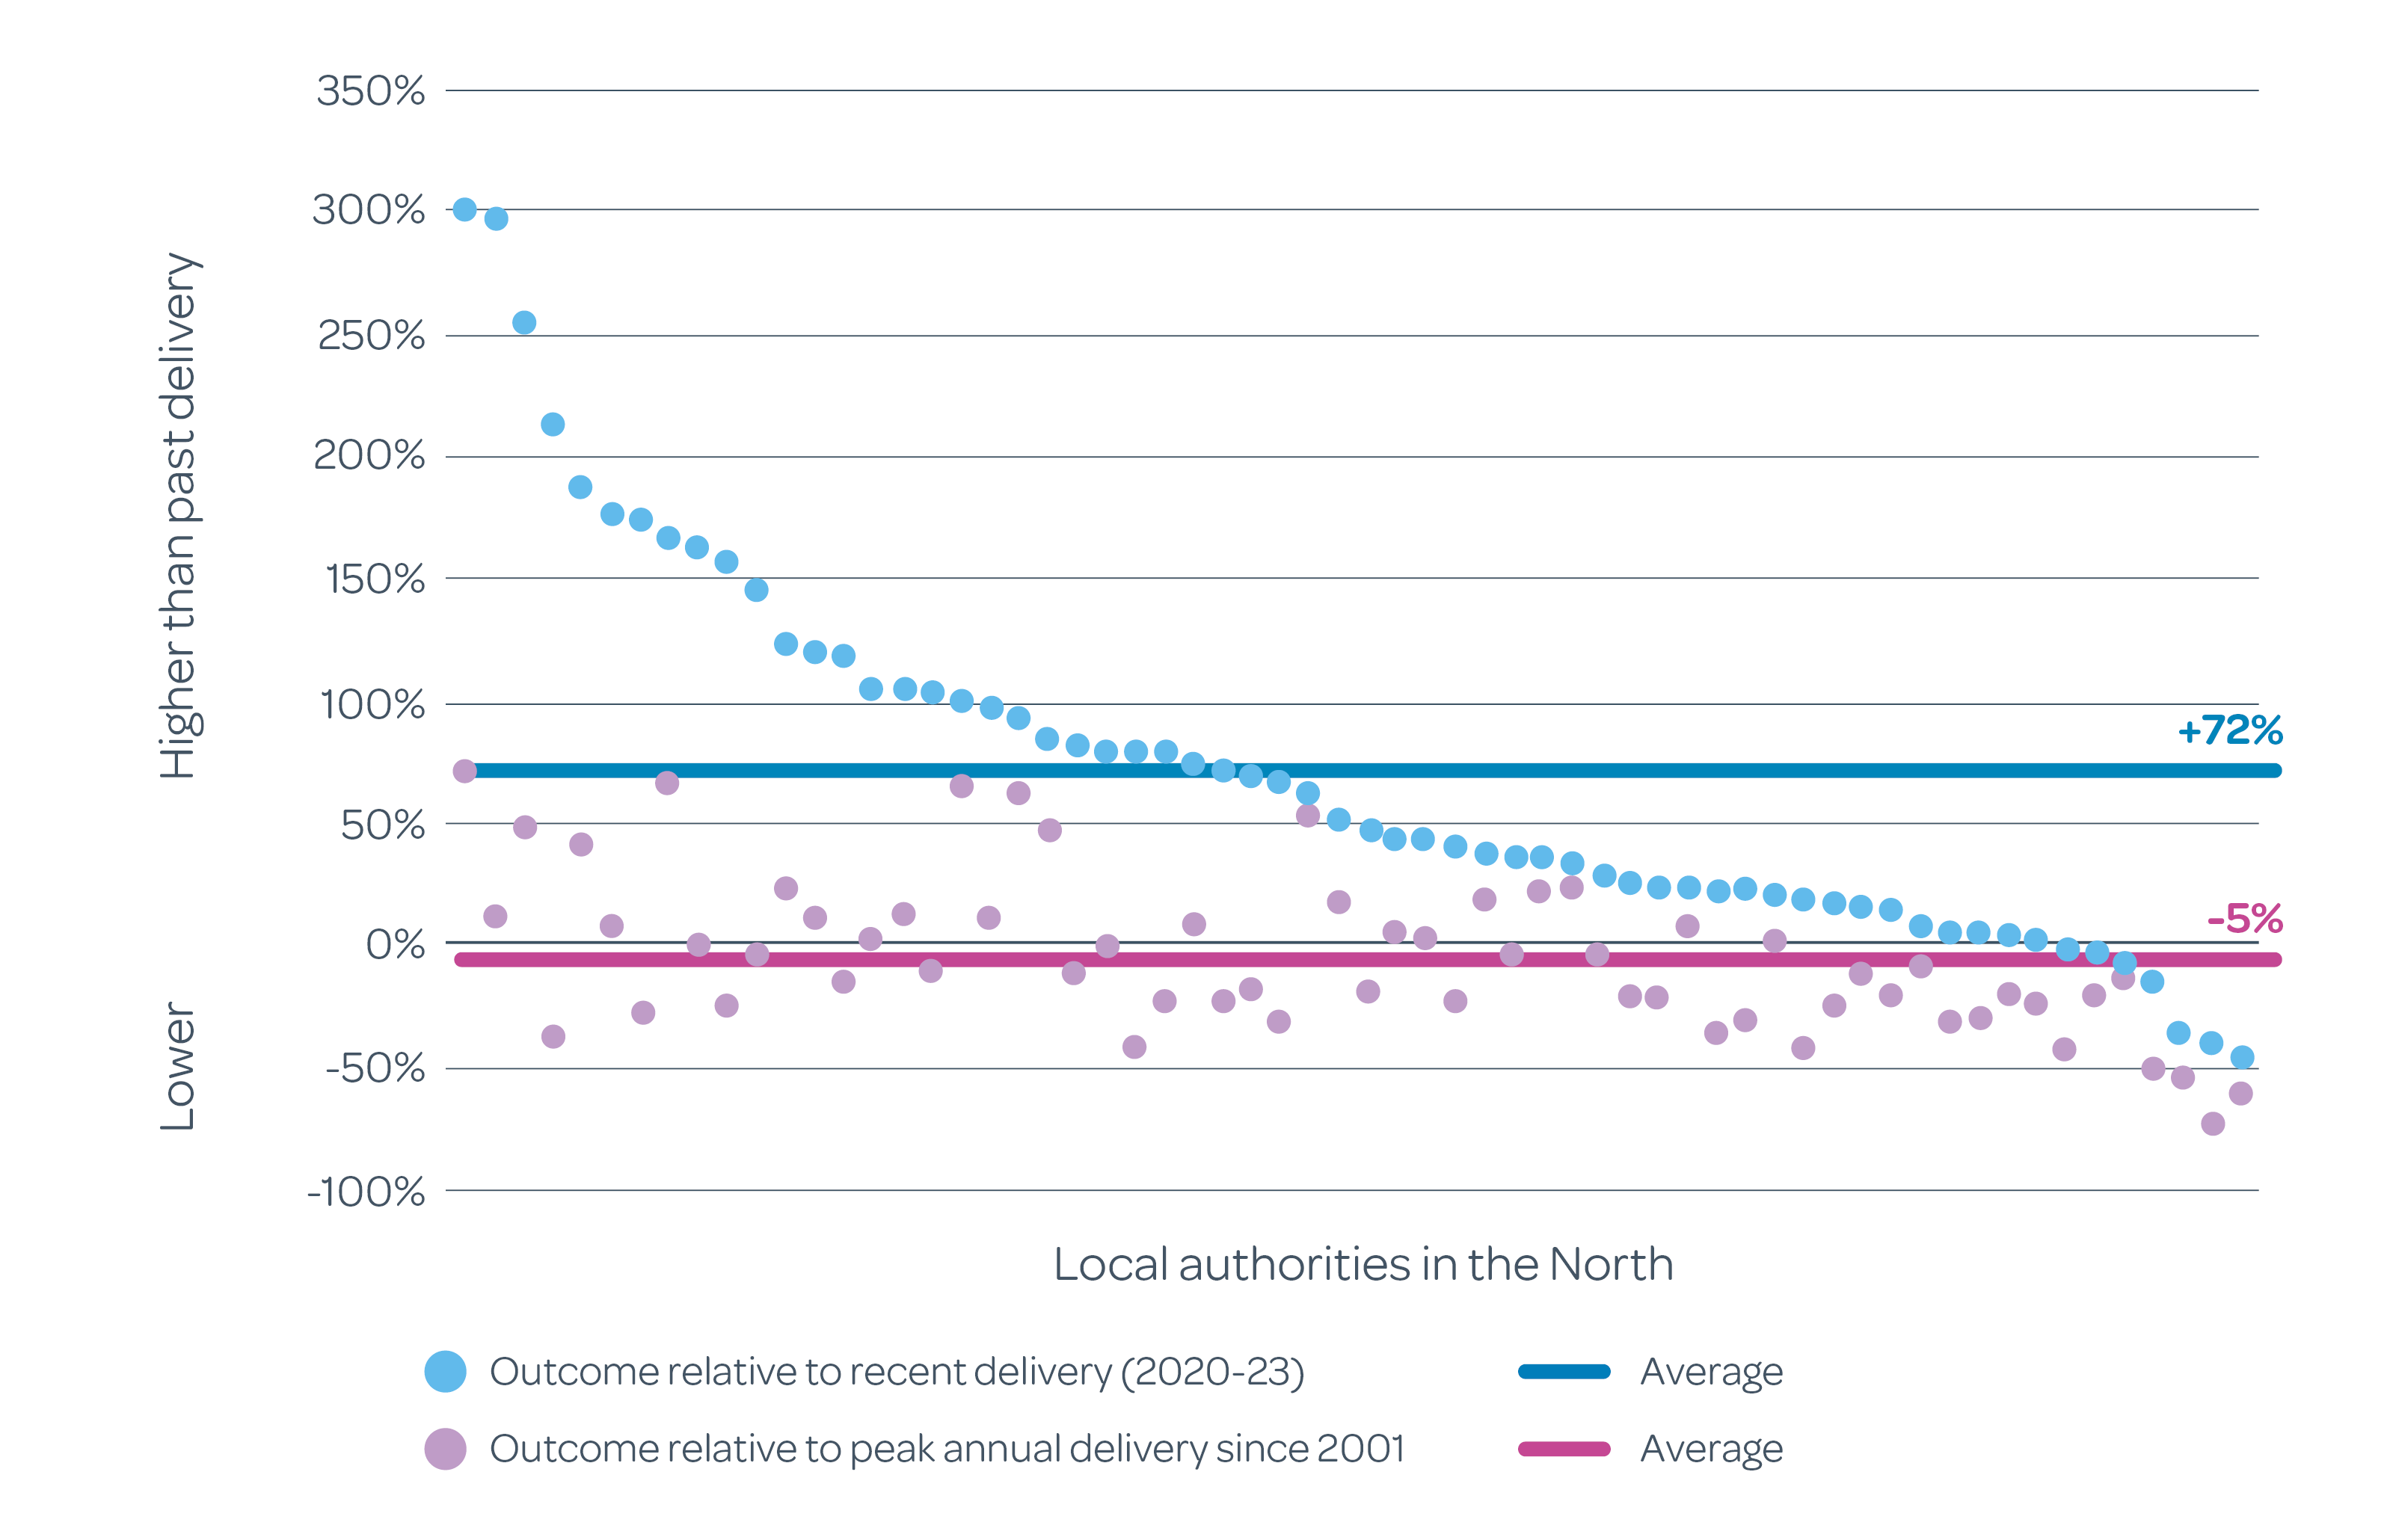
Eyebrows may well be raised by new figures that would typically necessitate a 72% increase in recent delivery, included in the Government’s summary for context. However, there is consensus that recent delivery has been wholly inadequate. Of more relevance, therefore, is that those same figures are on average some 5% below peak annual delivery over a longer-term period back to 2001.
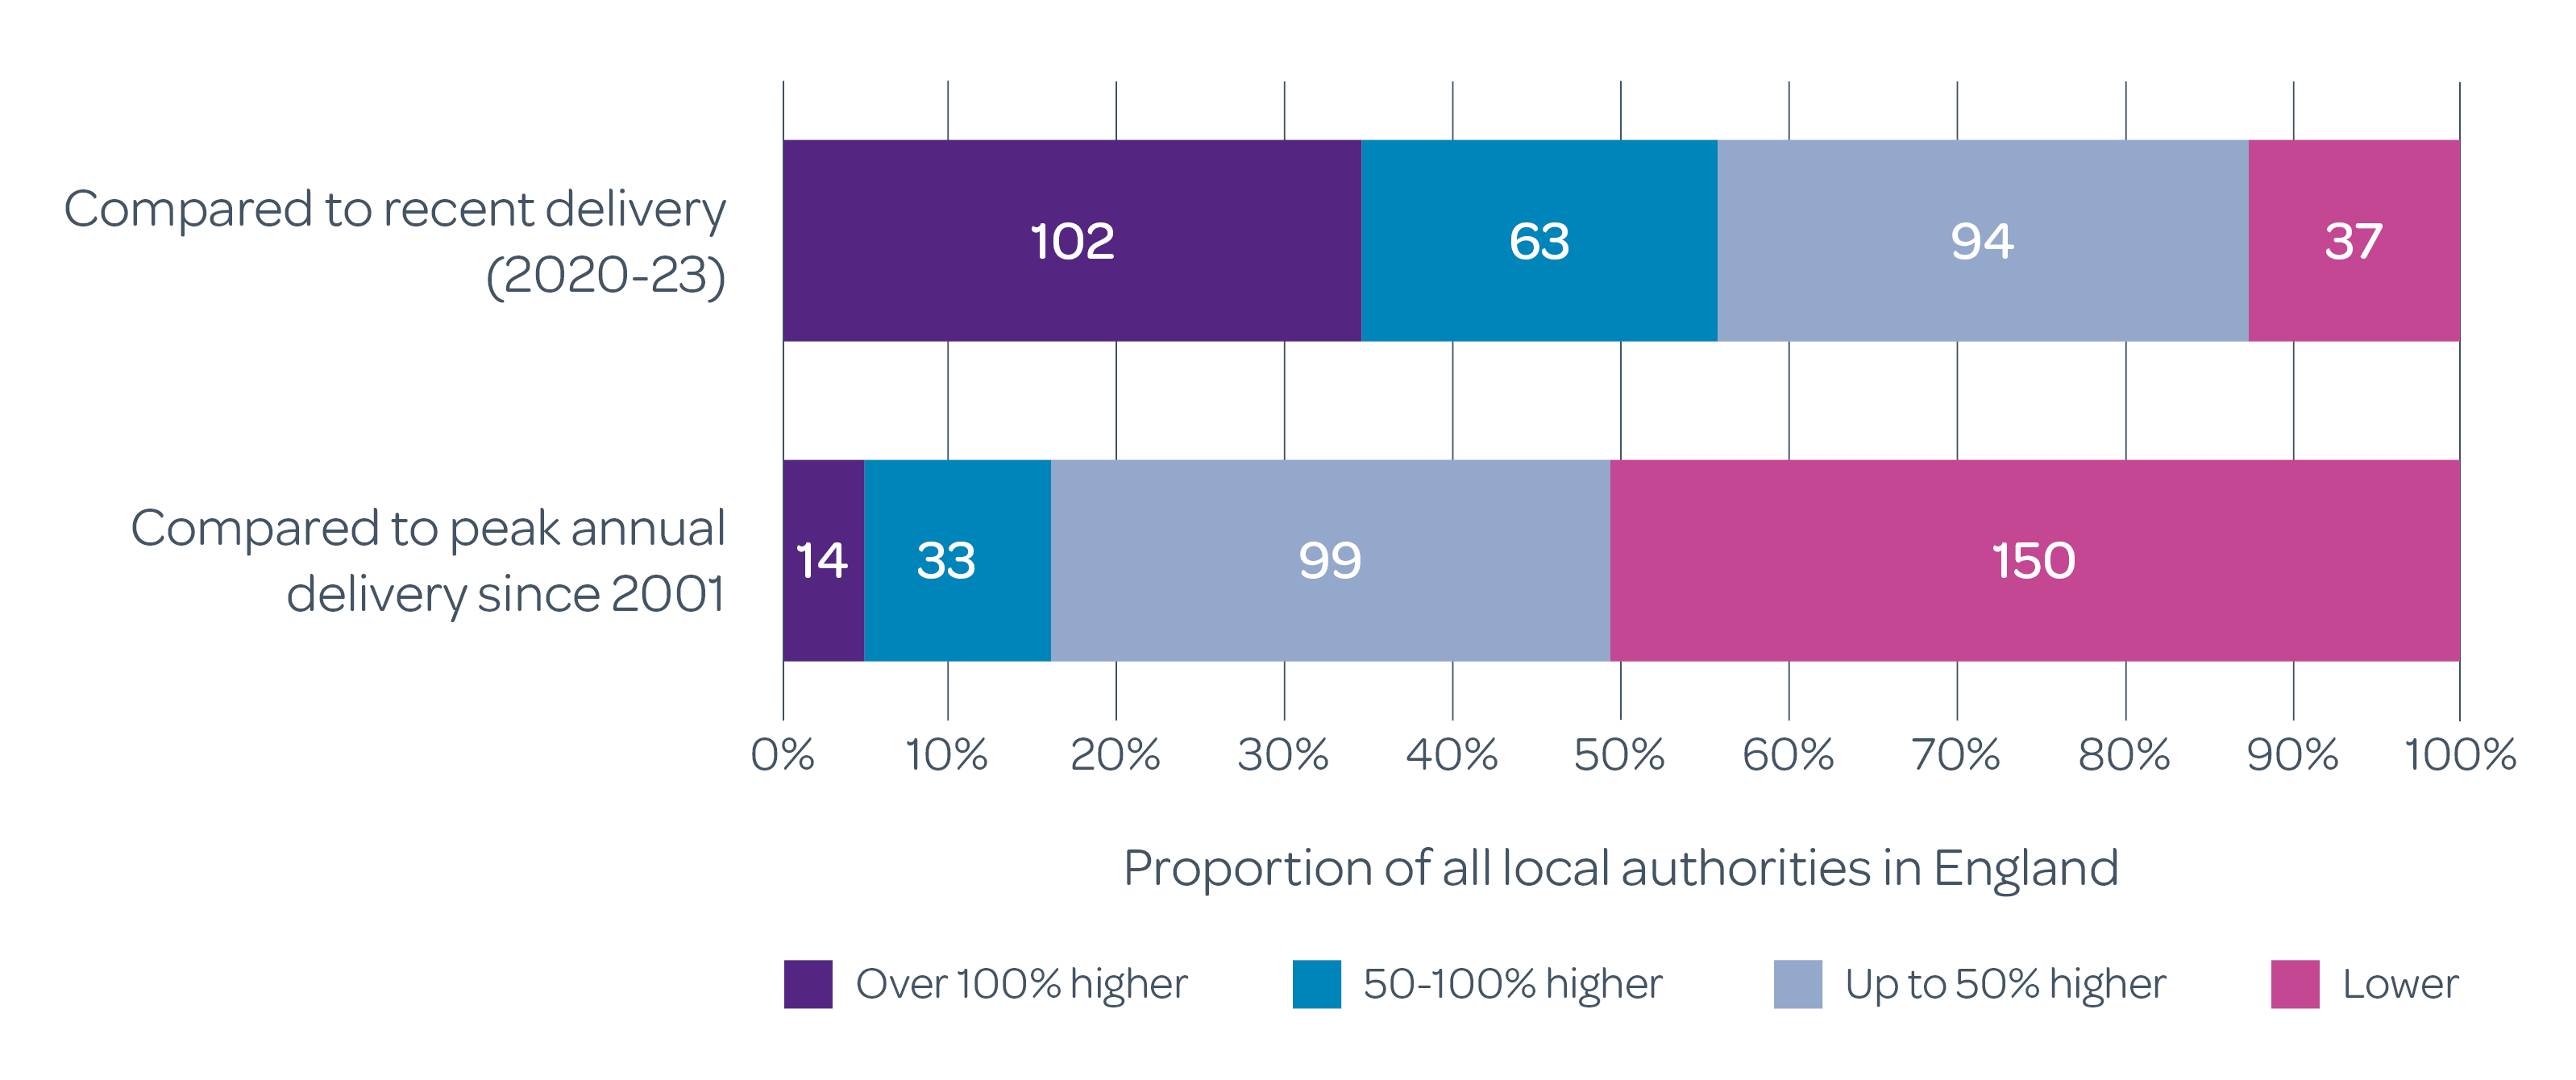
This is also true of many other parts of the country. The figures published by Government may, on average, be 110% higher than reported delivery between 2020 and 2023 but they are typically only 9% higher than individual authorities’ best year since 2001. They are actually lower than these peaks in just over half of all cases.
Returning to, and then sustaining, this peak rate of delivery will naturally be a challenge, but so is tackling the national housing crisis. It is right, in this context, that a standard method is ambitious in setting stretching targets, which maximise – rather than forego – contributions from those parts of the country that have a track record of delivering homes. The reality is that these are the scale of changes that are essential if the Government is to have any hope of getting delivery consistently up to and above 300,000 homes a year – let alone near 372,000.
For further information on the proposed new standard method please contact Andrew Lowe.
Watch this space for further detailed commentary on the proposed NPPF reforms.
1 August 2024
[1] In the existing method, the affordability adjustment is applied in increments of 0.25 but this is proposed to increase to 0.6. This means that an area previously applying an uplift of 30% would now apply an uplift of 72%
[2] Capturing the North West, North East, Yorkshire and the Humber
You may also be interested in
News
8 July 2024
Turley calls for urgent reforms to planning system following Keir Starmer’s election win
We are urging the new Labour Government to prioritise solving the housing crisis in a new paper launched today following the ...