News
Turley collaborates with the LPDF to count the cost of delayed Local Plans
Working with the Land Promoters and Developers Federation (LPDF), our newest research quantifies the costs of Local Plan delays that have become increasingly common.
A growing number of local authorities in England have paused work on their Local Plans over the last year, often citing uncertainty caused by the Government’s proposed planning reforms.
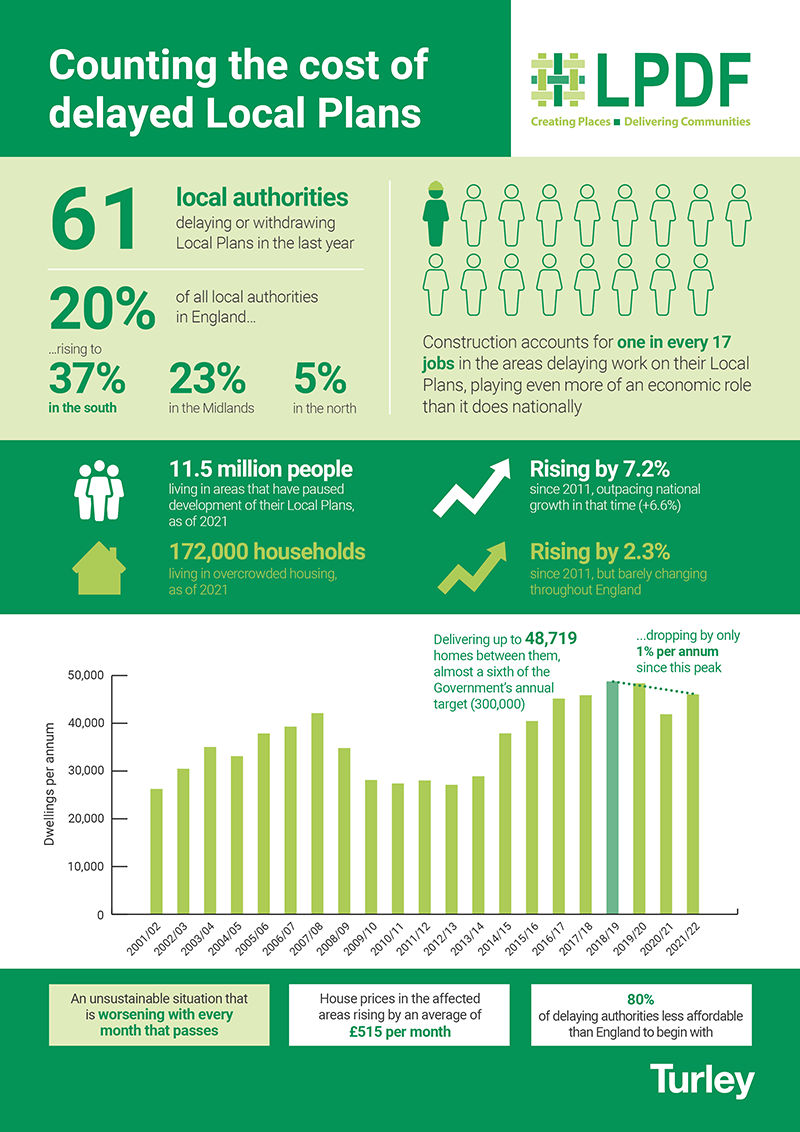
The LPDF has been working with the Home Builders Federation (HBF) to track the authorities that have delayed or withdrawn their Local Plans. It estimates that 61 had done so as of early August 2023, remarkably equating to exactly one fifth of all local authorities throughout England[1]. Three quarters of those delaying were in the south, including London, with roughly 37% of all in that region taking this approach[2]. The equivalent figure for the Midlands was 23%, falling to just 5% in the north.

Population growth and overcrowding
The authorities delaying their Local Plans were collectively home to some 11.5 million people, as of the 2021 Census. This had increased by 7.2% over the prior decade, meaning that their populations had grown roughly a tenth faster than England as a whole (6.6%).
They were also home, in 2021, to nearly 172,000 households living in overcrowded conditions, with at least one fewer bedroom than they required based on the bedroom standard. This figure has also risen, by 2.3%, when there was virtually no change seen nationally[3].
Construction as a major employer
Construction plays a valuable economic role in each area, with some 294,250 construction jobs offered in total throughout the areas directly affected by delayed Local Plans[4]. This equates to 6% of their jobs across all sectors, surpassing the national average (4.9%), thus showing just how important construction is to livelihoods in these areas.
These jobs will have been sustained in part by recent housing development, with the delaying authorities having proven their ability to deliver at scale by collectively overseeing the completion of as many as 48,719 homes in any single recent year[5]. They achieved this in 2018/19, after growing their combined output for five consecutive years at an average rate of 12% per annum. They also managed to broadly maintain this level of delivery over the three reported years since, dropping on average by a fractional 1% per annum.
Affordability
It is highly unlikely that this will continue if the authorities continue to delay work on their Local Plans, and thereby fail to replenish their supply of housing sites. The impact of such delays is likely to only grow with every month that passes, as the average cost of purchasing a home in any of the affected areas has recently been rising by an average of £515 per month[6]. This has increased costs in areas that were generally unaffordable to begin with, as 80% of the delaying local authorities had a greater imbalance between median house prices and earnings than the country as a whole did last year[7].
Conclusion
The above starkly demonstrates why the local authorities that have delayed work on their Local Plans must resume activity at the earliest possible opportunity, building in the flexibility to respond to future reforms rather than simply using them to justify inaction. The current situation is unsustainable, and leaving some of the country’s fastest growing areas – capable on their own of delivering almost a sixth of the Government’s housebuilding target – in a perpetual state of limbo.
Please click the link below to download the infographic.
For further information please contact Andrew Lowe or Antony Pollard.
4 September 2023
[1] Excluding National Park authorities. The tracker currently suggests that 60 local planning authorities have delayed or withdrawn their local plans, rather than 61, but one of the plans listed covers two local authorities (Vale of White Horse and South Oxfordshire) which are treated separately for the purposes of this analysis
[2] Including London, the South East, South West and East of England
[3] The number of overcrowded households in England is reported to have grown by only 219 between 2011 and 2021, equivalent to circa 0.02%
[4] Business Register and Employment Survey
[5] Table 122: housing supply, net additional dwellings by local authority district in England
[6] Between January 2021 and December 2022, according to price paid data released by the Land Registry
[7] Housing affordability in England and Wales, house price to workplace-based earnings ratios (2022)
You may also be interested in
News
18 May 2022
Turley collaborates with the LPDF to shine a spotlight on the affordable housing emergency
We have been commissioned by the Land Promoters and Developers Federation (LPDF), alongside Tetlow King Planning, to produce new research which ...